domingo, 23 de febrero de 2014

The effective use of the Compression

Hello again everybody. According to lesson for week 4 of Introduction to Music Production at Coursera.org, this week's topic is about how to use effectively a compressor in a musical context.

Basic concepts

Compression is one of the most important and used effects while recording. The songs we hear on the radio can go through 4 or even 5 different compressors. Due to the big importance, becomes useful the understanding of how compression works and how it can be applied efficiently.

Compression works by reducing the volume of the louder sections of a track and increasing the volume of the quieter sections, giving more consistency to tracks. This effect can also be used to bring out some important details: helps to control a vocalist with bad mic technique, limit distortion from loud sounds or increase the average level of a track, making it sound louder.

Compression Controls

Commonly, compressors offer some basic controls: threshold, ratio, attack and release. This controls allow to adjust the compression settings to get the desired results.

The threshold control, measured in dB, determines at what level the compressor kicks in to action. In other words, how loud the signal has to be before its volume is reduced, or the time the compressor has to wait before start working. Setting the Threshold high means less compression, and a low Threshold means compressor will do more.

When the input signal passes the threshold level, the gain is lowered by the ratio control. For example, with the ratio set at 2:1, an increase in input of 2 dB over the threshold will result in an increase in the output of 1 dB. Higher ratios means more compression applied, only to the signals which passed the threshold level.

The Attack and Release controls work together with the threshold control to determine when compression should begin and end. Specifically, Attack control refers to how much time waits the compressor to start processing the input signal once it achieves the Threshold, and Release control determines the time the compressor will keep processing the signal once this one has fallen below the Threshold level. It is important to keep in mind that if the input signal is above the Threshold for less time than the Attack setting, then compression may not occur. Setting a long attack allows transient waves to pass through before start compression; a short attack will cause the signal to be almost instantly compressed. On the other hand, a long release gives a natural sound, and a short release time will cause no compression instantly, causing an unnatural or distorted sounds.

How to adjust the compression. An example in Cubase

An important thing to have in mind is that every unit and every track is different. I recommend to start by setting a high threshold, low ratio and both the attack and release in a mid position. Then, move the threshold control down until feel that the compressor is reducing the signal. From there, adjust the controls bit by bit until get what we want, which may be a particular sound or a particular reduction in dynamic range. Here's an example using the Cubase Compressor over an clean electric guitar extracted from a track of my own music.


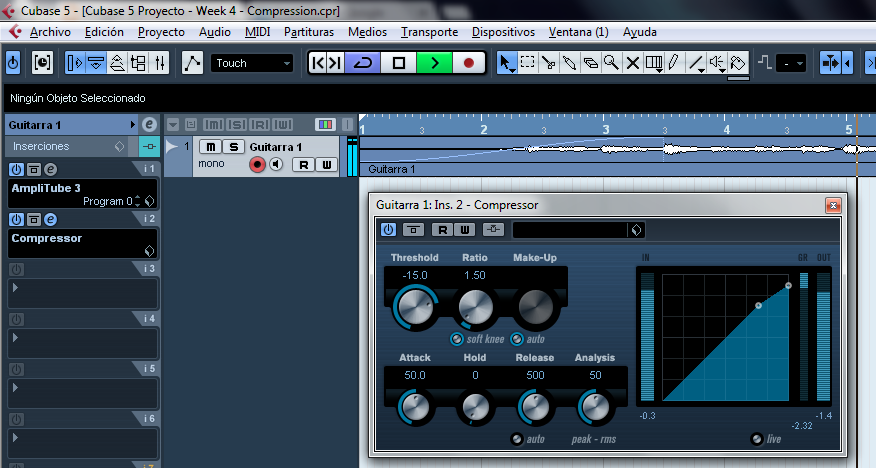
Following the instructions above, move down the Threshold until it reaches a desired level, which is after the compressor starts processing the signal. After that, set the Ratio level moving it bit by bit until get the desired sound. For this example, I moved the Threshold down to -30, and the Ratio to 6.


The Attack and Release times should generally correspond to the speed of the instrument. For example, bass tracks should normally use slow attack and release times while drum tracks usually sound best with fast times. Like we are using an electric clean guitar, I recommend to set long Attack and Release times. For this example I used 80 for the Attack and let the Release in 500, which is the middle position established before.


Once established the threshold, ratio, attack and release settings, we should look at the meters and increase the gain to avoid the gain reduction imposed by the compressor.  This can be done with the Make-Up control. Typically the gain on the compressor is set equal to the gain reduction shown on the meters.


Reflections

When I was learning the basics of compression with a compressor pedal for my guitar, I over-compressed the whole thing, what didn't help the sound at all. Compression is a great tool for mixing when we know how to use it well. Finding the right balance is the key, and the only way to do that is to practice and listen, with own mixes or with the mixes of our favorite music: some forms of music, especially acoustic music, sound best without any compression at all; electronic music, punk, and hip-hop often use huge amounts of compression; folk, country and other similar genres typically benefit from moderate compression.

Thanks once again for reading this week. I invite you to use the uncompressed audio in the first link and do these examples and experiment with some other values too. You can also listen to my band Tephros in the Soundcloud player at the right side of this page. We are re-recording the published tracks with the knowledge acquired in this course to get a better sound, and we are making it! Greetings and enjoy!

miércoles, 19 de febrero de 2014

Channel strip

Hi everyone! The topic we'll see this week is about the Channel Strip. Remember, this is according to lesson for week 3 of Introduction to Music Production at Coursera.org. The main purpose of this lesson is to teach how does a signal flow through a channel strip both in a DAW as in an analog mixing board, detailing every component, usage and position of the knobs.

¿What is a Channel Strip?


A Channel Strip is a device that allows the amplification of an input audio signal, and the control of sound effect levels applied to this one. A Channel Strip also allows the user to monitor critical listening and adjust equalization.

This device may be a stand alone unit or one of many units built into a mixing board (each one of the columns we see in there).


Parts of the Channel Strip: Analog Mixing Board and DAW

As we said before, an mixing board is composed by many channel strips, and we can find them analog (Mixer) and digital (DAW). The Channel Strip is normally composed by:

Input Section: This section contains XLR and Line inputs, which allows to introduce a input sound signal to the Channel Strip.
Trim knob: This knob is basically a preamp. Controls the input level of the signal.
Insert Section: The Insert Section allows to add or insert an external audio input to the original input signal, creating a species of mix in a single Channel Strip.
Aux sends: This knob controls a separate output for the current Channel Strip, being ussualy headphones or another mixer.
EQ Section: This section is composed by some equalization knobs which allows to manipulate the parameters of the input signal. We can see usually three knobs (High, Mid and Low equalization).
Pan knob: The Pan knob allows to control the relative level of the stereo (right and left) channels. It means that the input signal can be "moved" to the left speaker or to the right speaker according to the position of the knob, lowering the level of the opposite side. 
Mute button: This button silences or mutes the current Channel Strip.
Solo button: This button isolates the signal of the current Channel Strip, muting all others.
Fader: Controls the level of the output signal, which is sent to the master bus of the mixer, and controlled again by a master fader.

Another important thing to have in mind is that ussually a Channel Strip works with the signal flowing from the top to the bottom, but is not always this way. My personal mixer, a Peavey XR 680E Powered Mixer is a proof of this (sorry about the dust):


As you can see, this is a basic mixer. The input section (Line and Mic) at the bottom of the Strips. This mixer doesn't have a Trim knob, Insert Section, Aux Sends, Mute button and Solo button. But has an Effects Level Section, which adds some Reverb to the Channel, perfect for using in voices.

On the other hand, the DAW I use is Cubase 5. To open the Mixer we can select it from the Devices Menu or just pushing F3. The Cubase 5 mixer is like this:


The Channel Strip of the Cubase Mixer is visibly complete than my analog mixer, having all the sections already mentioned, and allowing a wider control over the signals worked in the DAW project. 

Reflections

The Channel Strip is a really important tool not just in the recording area; when we use a mixer in live performances or rehearsals, we should know at least the basic controls of these devices, to ensure a better mix and a great sound for the listeners. Thanks very much for reading again. This material wasn’t new to me but thanks to the reading and researching about this topic, I clarified some terms and concepts. I hope this you enjoyed this info and that this may be useful like it was for me. Comment!

domingo, 9 de febrero de 2014

The Analog to Digital conversion process

Hello everybody. This week we will be learning about the analog to digital conversion, according to lesson for week 2 of Introduction to Music Production at Coursera.org. 


So first of all, what is analog and digital?

As we said last week, sound is produced by pressure variations in the air. When a microphone converts the input signal into voltage (through a cable, an amplifier or stereo), the electrical current vary similarly to the variation in the air pressure generated by the sound wave. It is continuous and constant, like pressure variations. That´s why it is called analogue (similar). 

On the other hand, digital systems need to convert the input audio signal into digital data that could be processed by numerical calculations. This process results into digital information based on bits (basic unit of information in computing and digital communications). The term bit is a contraction of BInary digIT. 


A single bit can have only one of two values, and may therefore be physically implemented with a two-state device. So, having a single bit, the two values can be interpreted as logical values (true/false, yes/no), algebraic signs (+/−), states (on/off), or any other two-valued attribute. The most common representation of these values are 0 and 1. But if we want to represent larger numbers, we have to start a bit string, collecting bits into "words", so a specific number of bits (word length) allows the representation of a specific number of values. 


How does it work? How do we convert one into the other? The analog to digital process


The device responsible for changing an analog signal into a series of numbers is the analog-to-digital converter (or A/D converter). It works by repeatedly measuring the amplitude (volume) of an incoming electrical pressure soundwave (an electrical voltage), and outputting these measurements as a long list of samples, assigning a binary value for each sample´s amplitude. In this way, a mathematical "picture" of the shape of the wave is created. Every audio interface has an Analog-Digital Converter.

The converter's sample rate dictates how often it measures the signal to generate a new value, splitting the signal into samples separated by identical time intervals. The amount of samples measured per seconds is called Sample Rate. The more frequently the converter measures the signal, the more accurate the resulting data. To capture the full audio spectrum up to around 20,000 cycles (or 20kHz), a sample rate of 44.1kHz is common. Higher sample rates make for increased treble response and a more "hi-fi" sound. Low sample rates sound duller and darker. 

Bit depth affects how many bits the converter uses for each numerical measurement of the signal. More bits equal a more accurate measurement, which explains why 16-bit CD audio sounds so much better than an 8-bit multimedia sound file. A low bit depth is like forcing the converter to measure the sound with a yardstick marked only in inches. A higher bit depth allows the converter much greater accuracy (a yardstick marked in 1/8th-inch increments, for example). 


It may help to picture the interaction of sample rate and bit depth as a grid used to measure an audio signal. A higher sample rate corresponds to better accuracy on the horizontal axis; greater bit depth corresponds to vertical resolution. 

With this process, the audio signal changes a fundamental characteristic: It stopped being a continuous to become a discrete signal, which is discontinuous, separated by steps, and this important because as we gain something with digital audio, we also loose something else. While digital audio offers high precision, simplified editing and processing, storage facility and audio quality over time, analog sound is known to provide more sound depth and warmth, though is prone to produce higher noise levels, and to deteriorate with time.


Reflections

This topic is quite complex and interesting, it's a really fascinating process that represents the basis of all current digital recording technology. Without this process, the digitalization of the sound signals would not be possible. I hope you find useful this simplified explanation of this important process. Thanks very much for reading again, don't forget to comment.

jueves, 6 de febrero de 2014

Visualizing Sounds

Introduction

My name is José M. Pérez. I am from Barquisimeto, Venezuela. This week we will be learning about Sound Visualization, according to lesson for week 1 of Introduction To Music Production at Coursera.org.


A little theory first...

¿What's sound? Sound is a vibration that propagates as a mechanical wave of pressure and displacement, through some medium (such as air or water). Although sometimes sound refers to only those vibrations with frequencies that are within the range of hearing. 

For visualizing sound, we have to know some other terms related, such as:

Amplitude

Amplitude is related to the extent of the wave, how wide it's moving, or how much the air compresses and rarefies as that wave form moves or propagates through the air. Visually, looks like the height of a waveform above or below its zero baseline. Amplitude is also referred to as signal volume, and looks like this: 


Frequency

Frequency refers to the rate or speed at which an audio source generates complete cycles in one second. This property determines the pitch of the sound. It is only useful or meaningful for musical sounds, where there is a strongly regular waveform.


Pitch

Pitch is closely related to frequency, but the two are not equivalent. Pitch is an auditory sensation in which a listener assigns musical tones to relative positions on a musical scale based primarily on the frequency of vibration. In other words, pitch is the frequency of a note determining how high or low it sounds.

Tools for visualizing sounds

Oscilloscope

Is a type of electronic test instrument that allows observation of constantly varying signal voltages, usually as a two-dimensional plot of one or more signals as a function of time. Non-electrical signals such as sound or vibration can be converted to voltages and displayed.

The oscilloscope measures the amplitude of the wave on the y (vertical) axis and time on the x (horizontal) axis. In the next example, Y axis is simply a linear scale with 0 as no signal and 1 or -1 as a fully saturated signal. You can see that the amplitude of the wave is decreasing over time, and that the frequency is growing higher because the distance between waves is shorter.


Spectrum Analyzer


A spectrum analyzer measures the amplitude of an input signal (y axis) versus frequency within the full frequency range of the instrument (x axis). The primary use is to measure the power of the spectrum of known and unknown signals. This provides a snapshot into the energy distribution by frequency. Since it is a snapshot, it doesn't contain information on how those energy distributions change over time. Common applications include measurements of distortion, and to measure the harmonics within a signal.


Sonogram

Is an instrument that separates an incoming wave into a visual representation of the spectrum of frequencies in a sound or other signal as they vary with time or some other variable. The sonogram represents time on the x axis, frequency on the y axis, and amplitude mapped by color change. It gives the clearest picture of how our ears actually hear over time. In the next sonogram we can see that the amplitude of the wave is decreasing over time while the frequency is increasing. It provides a good sense of frequency increasing as decibel level decreases.


Reflections

Thanks very much for reading. The material wasn’t new to me but I needed to write a script to reafirm and clarify the terms, and when I was doing this post I learned some things that I was missing. I hope this info may be useful like it was for me, and I would love to know if I got everything right. If there's anything I missed or could have explained better, please comment and I would be happy to modify or correct what's necessary.